


Relationship between new surrogate marks of insulin resistance and bone mineral content in adolescents
-
摘要:
目的 分析青少年新型简化胰岛素抵抗(IR)指标与骨矿物质含量(BMC)的关系及其对骨量低下的评估效果,为早期识别和防治青少年骨骼相关疾病提供科学依据。 方法 于2017年9月—2020年9月,通过方便抽样和分层整群随机抽样的方法抽取银川市1 594名12~18岁青少年,并计算三酰甘油-葡萄糖指数(TyG)、三酰甘油葡萄糖-体重指数(TyG-BMI)及三酰甘油和高密度脂蛋白胆固醇比值(TG/HDL-C)作为新型简化IR指标。使用偏相关分析不同简化IR指标与BMC水平的相关性,使用二元Logistic回归分析青少年IR指标与骨量低下的关系,构建受试者工作特征(ROC)曲线分析其对骨量低下的评估效果。 结果 校正性别、年龄、吸烟、饮酒、高血压家族史、收缩压(SBP)、舒张压(DBP)混杂因素后,新型简化IR指标与BMC水平均呈正相关(TyG:r=0.11;TyG-BMI:r=0.58;TG/HDL-C:r=0.21);进一步调整体质量指数(BMI)、体脂肪(FM)、瘦体重(LM)指标后,IR指标与BMC的关系转为负相关(TyG:r=-0.20;TyG-BMI:r=-0.18;TG/HDL-C:r=-0.14)(P值均<0.01)。Logistic回归分析结果显示,调整性别、年龄、吸烟、饮酒、高血压家族史、SBP、DBP因素后,TyG、TyG-BMI、TG/HDL-C水平升高青少年发生骨量低下的可能性降低(TyG:OR=0.63,95%CI=0.40~0.98;TyG-BMI:OR=0.94,95%CI=0.93~0.96;TG/HDL-C:OR=0.31,95%CI=0.17~0.58,P值均<0.05);调整BMI、FM、LM指标后,TyG和TG/HDL-C值高的女生发生骨量低下的可能性分别是低水平女生的4.95和4.38倍(TyG:OR=4.95,95%CI=1.29~18.95;TG/HDL-C:OR=4.38,95%CI=1.04~18.50,P值均<0.05)。ROC曲线显示,TyG-BMI对骨量低下的评估效果最佳(AUC=0.80,95%CI=0.77~0.83,P<0.01)。 结论 青少年新型简化IR指标与BMC呈负相关,其中TyG-BMI对骨量低下的评估效果最佳,可作为早期识别骨量低下的可靠指标。 Abstract:Objective To analyze the relationship between new surrogate marks of insulin resistance (IR) and bone mineral content (BMC) in adolescents, and predictive value of the new surrogate marks on low bone mass, so as to provide scientific basis for early identification and prevention of skeletal-related diseases in adolescents. Methods A total of 1 594 adolescents aged 12-18 years in Yinchuan City were selected by convenience sampling and stratified cluster random sampling from September 2017 to September 2020, and triglyceride and glucose index (TyG), triglyceride glucose-body mass index (TyG-BMI) and triglyceride/high-density lipoprotein cholesterol (TG/HDL-C) were calculated as new simplified IR index. The correlation between different simplified IR indexes and BMC level was analyzed by partial correlation. Binary Logistic regression was used to analyze the relationship between IR index and low bone mass, and receiver operating characteristic (ROC) curve was constructed to analyze its evaluation effect on low bone mass. Results After adjusting for confounding factors such as gender, age, smoking, drinking, family history of hypertension, systolic blood pressure (SBP) and diastolic blood pressure (DBP), the new surrogate marks of IR were positively correlated with BMC level (TyG: r=0.11, TyG-BMI: r=0.58, TG/HDL-C: r=0.21, P<0.01). After further adjustment of body mass index (BMI), fat mass (FM) and lean mass (LM), the relationship between IR indexes and BMC turned into negative correlation (TyG: r=-0.20, TyG-BMI: r=-0.18, TG/HDL-C: r=-0.14, P<0.01). After adjusting for confounding factors such as gender, age, smoking, drinking, family history of hypertension, SBP and DBP, Logistic regression results showed that the increase of TyG, TyG-BMI and TG/HDL-C levels reduced the possibility of low bone mass in adolescents (TyG: OR=0.63, 95%CI=0.40-0.98, TyG-BMI: OR=0.94, 95%CI=0.93-0.96, TG/HDL-C: OR=0.31, 95%CI=0.17-0.58, P<0.01). After adjusting BMI, FM and LM, the above results were completely reversed. Girls with high TyG and TG/HDL-C levels were 4.95 and 4.38 times more likely to have low bone mass than those with low TyG and TG/HDL-C levels (TyG: OR=4.95, 95%CI=1.29-18.95, TG/HDL-C: OR=4.38, 95%CI=1.04-18.50, P<0.05). ROC curve showed that TyG-BMI had the best predictive value on low bone mass (AUC=0.80, 95%CI=0.77-0.83, P<0.01). Conclusion The new surrogate marks of IR in adolescents are negatively correlated with adolescent BMC, of which TyG-BMI is the best for assessing of low bone mass and can serving as a reliable indicator for early identification of low bone mass. -
Key words:
- Insulin resistance /
- Bone and bones /
- Minerals /
- Growth and development /
- Regression analysis /
- Adolescent
1) 利益冲突声明 所有作者声明无利益冲突。 -

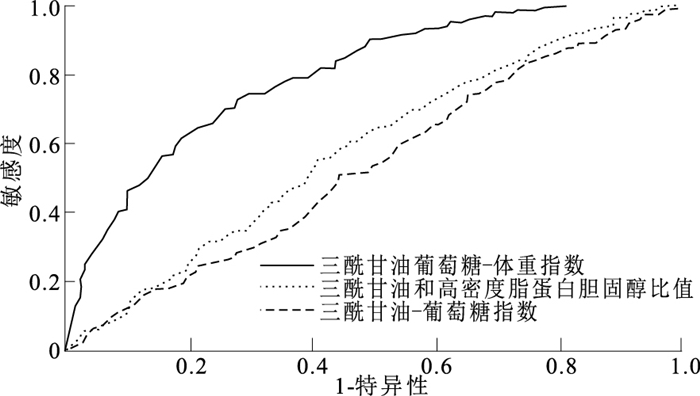
图 1 青少年新型简化胰岛素抵抗指标评估BMC低下的ROC曲线
Figure 1. ROC curve of new surrogate marks of insulin resistance in evaluating low BMC in adolescents
表 1 不同性别儿童青少年基本特征比较(x±s)
Table 1. Comparison of basic characteristics among children and adolescents of different gender(x±s)
性别 人数 年龄/岁 身高/cm 体重/kg BMI/(kg·m-2) 腰围/cm SBP/mmHg DBP/mmHg FPG/(mg·dL-1) 总胆固醇/(mg·dL-1) HDL-C/(mg·dL-1) LDL-C/(mg·dL-1) 男生 983 14.97±1.44 171.20±8.03 60.73±13.85 22.62±1.85 74.02±10.87 113.86±11.71 67.19±8.13 86.45±13.31 151.62±36.34 54.18±13.95 83.48±30.62 女生 611 14.44±1.50 162.44±6.05 54.64±10.82 22.29±2.41 74.50±9.11 109.47±10.54 69.18±7.78 85.00±10.38 154.92±37.52 57.30±16.29 81.63±28.41 合计 1 594 14.76±1.49 167.84±8.48 58.40±13.11 22.49±2.09 74.20±10.23 112.17±11.47 67.95±8.06 85.89±12.28 152.89±36.82 55.37±14.96 82.77±29.79 t值 7.02 23.20 9.25 3.04 -0.90 7.56 -4.82 2.29 -1.74 -4.08 1.21 P值 < 0.01 < 0.01 < 0.01 < 0.01 0.37 < 0.01 < 0.01 0.02 0.08 < 0.01 0.23 性别 人数 FM/kg* LM/kg* TG/(mg·dL-1)* TyG* TyG-BMI* TG/HDL-C* BMC/kg 男生 983 7.90(5.70, 13.60) 49.30(44.00, 54.70) 79.72(62.89, 103.63) 8.15(7.91, 8.43) 157.69(142.79, 185.02) 0.64(0.49, 0.90) 2.83±0.52 女生 611 14.30(10.80, 19.00) 38.10(35.50, 41.60) 81.49(65.54, 107.17) 8.14(7.87, 8.43) 161.38(147.28, 184.74) 0.65(0.49, 0.89) 2.39±0.34 合计 1 594 10.80(6.70, 16.70) 44.50(38.50, 51.43) 80.60(63.77, 104.52) 8.13(7.84, 8.42) 159.56(144.22, 184.96) 0.65(0.49, 0.89) 2.66±0.51 t/Z值 -15.81 -25.15 -2.07 -1.25 -2.03 -0.27 18.63 P值 < 0.01 < 0.01 0.04 0.21 0.04 0.79 < 0.01 注: *采用M(P25,P75)描述;1 mmHg=0.133 kPa。  下载: 导出CSV
表 2 青少年新型简化IR指标与BMC的相关性分析(r值)
Table 2. Correlation analysis between the new surrogate marks of IR and BMC in adolescents(r)
模型 男生(n=983) 女生(n=611) 总体(n=1 594) 模型一 TyG 0.13** 0.09 0.11** TyG-BMI 0.62** 0.55** 0.58** TG/HDL-C 0.24** 0.14** 0.21** 模型二 TyG -0.19** -0.24** -0.20** TyG-BMI -0.15 -0.29** -0.18** TG/HDL-C -0.12** -0.16** -0.14** 注:模型一调整性别、年龄、吸烟、饮酒、高血压家族史、SBP、DBP;模型二在模型一的基础上调整BMI、FM、LM。**P<0.01。
下载: 导出CSV
表 3 青少年新型简化IR指标与BMC低下的Logistic回归分析[OR值(95%CI)]
Table 3. Logistic regression analysis of the new surrogate marks of IR and low BMC in adolescents[OR(95%CI)]
性别 自变量 模型一 模型二 模型三 男生 TyG 0.64(0.43~0.95)* 0.49(0.27~0.89)* 2.20(0.81~5.96) (n=983) TyG-BMI 0.94(0.93~0.95)** 0.93(0.91~0.95)** 1.00(0.97~1.03) TG/HDL-C 0.31(0.17~0.55)** 0.15(0.06~0.40)** 1.55(0.40~6.00) 女生 TyG 1.03(0.59~1.80) 0.89(0.45~1.80) 4.95(1.29~18.95)* (n=611) TyG-BMI 0.96(0.94~0.97)** 0.96(0.94~0.97)** 1.02(0.99~1.06) TG/HDL-C 0.59(0.31~1.13) 0.62(0.27~1.42) 4.38(1.04~18.50)* 总体 TyG 0.74(0.54~1.03) 0.63(0.40~0.98)* 2.19(1.10~4.40)* (n=1 594) TyG-BMI 0.95(0.94~0.95)** 0.94(0.93~0.96)** 1.00(0.98~1.02) TG/HDL-C 0.40(0.26~0.62)** 0.31(0.17~0.58)** 2.34(1.03~5.31)* 注:模型一未调整变量;模型二调整性别、年龄、吸烟、饮酒、高血压家族史、SBP、DBP;模型三在模型二的基础上调整BMI、FM、LM。*P<0.05,**P<0.01。
下载: 导出CSV
-
[1] LEBOFF M S, GREENSPAN S L, INSOGNA K L, et al. The clinician's guide to prevention and treatment of osteoporosis[J]. Osteoporos Int, 2022, 33(10): 2049-2102. doi: 10.1007/s00198-021-05900-y [2] MCCORMACK S E, COUSMINER D L, CHESI A, et al. Association between linear growth and bone accrual in a diverse cohort of children and adolescents[J]. JAMA Pediatr, 2017, 171(9): e171769. doi: 10.1001/jamapediatrics.2017.1769 [3] GORDON C M, ZEMEL B S, WREN T A, et al. The determinants of peak bone mass[J]. J Pediatr, 2017, 180: 261-269. doi: 10.1016/j.jpeds.2016.09.056 [4] CONTE C, EPSTEIN S, NAPOLI N. Insulin resistance and bone: a biological partnership[J]. Acta Diabetol, 2018, 55(4): 305-314. doi: 10.1007/s00592-018-1101-7 [5] LEI W S, KINDLER J M. Insulin resistance and skeletal health[J]. Curr Opin Endocrinol Diabetes Obes, 2022, 29(4): 343-349. doi: 10.1097/MED.0000000000000738 [6] WANG S, SHI J, PENG Y, et al. Stronger association of triglyceride glucose index than the HOMA-IR with arterial stiffness in patients with type 2 diabetes: a real-world single-centre study[J]. Cardiovasc Diabetol, 2021, 20(1): 82. doi: 10.1186/s12933-021-01274-x [7] KIM J, SHIN S J, KANG H T. The association between triglyceride-glucose index, cardio-cerebrovascular diseases, and death in Korean adults: a retrospective study based on the NHIS-HEALS cohort[J]. PLoS One, 2021, 16(11): e0259212. doi: 10.1371/journal.pone.0259212 [8] HUANG R, CHENG Z, JIN X, et al. Usefulness of four surrogate indexes of insulin resistance in middle-aged population in Hefei, China[J]. Ann Med, 2022, 54(1): 622-632. doi: 10.1080/07853890.2022.2039956 [9] LOCATELI J C, LOPES W A, SIMOES C F, et al. Triglyceride/glucose index is a reliable alternative marker for insulin resistance in South American overweight and obese children and adolescents[J]. J Pediatr Endocrinol Metab, 2019, 32(10): 1163-1170. doi: 10.1515/jpem-2019-0037 [10] 全国学生体质与健康调研组. 2014年全国学生体质与健康调研手册[M]. 北京: 高等教育出版社, 2014: 41-47.Group National Student Physical Fitness and Health Survey. 2014 national student physical fitness and health survey handbook[M]. Beijing: Higher Education Press, 2014: 41-47. (in Chinese) [11] FALKNER B, DANIELS S R. Summary of the fourth report on the diagnosis, evaluation, and treatment of high blood pressure in children and adolescents[J]. Hypertension, 2004, 44(4): 387-388. doi: 10.1161/01.HYP.0000143545.54637.af [12] FEWTRELL M S. Bone densitometry in children assessed by dual X ray absorptiometry: uses and pitfalls[J]. Arch Dis Child, 2003, 88(9): 795-798. doi: 10.1136/adc.88.9.795 [13] SIMENTAL-MENDIA L E, RODRIGUEZ-MORAN M, GUERRERO-ROMERO F. The product of fasting glucose and triglycerides as surrogate for identifying insulin resistance in apparently healthy subjects[J]. Metab Syndr Relat Disord, 2008, 6(4): 299-304. doi: 10.1089/met.2008.0034 [14] KHAMSEH M E, MALEK M, ABBASI R, et al. Triglyceride glucose index and related parameters (triglyceride glucose-body mass index and triglyceride glucose-waist circumference) identify nonalcoholic fatty liver and liver fibrosis in individuals with overweight/obesity[J]. Metab Syndr Relat Disord, 2021, 19(3): 167-173. doi: 10.1089/met.2020.0109 [15] ZHAN H, LIU X, PIAO S, et al. Association between triglyceride-glucose index and bone mineral density in US adults: a cross sectional study[J]. J Orthop Surg Res, 2023, 18(1): 810. doi: 10.1186/s13018-023-04275-6 [16] YANG J, HONG N, SHIM J S, et al. Association of insulin resistance with lower bone volume and strength index of the proximal femur in nondiabetic postmenopausal women[J]. J Bone Metab, 2018, 25(2): 123-132. doi: 10.11005/jbm.2018.25.2.123 [17] HONG A R, KIM J H, LEE J H, et al. Metabolic characteristics of subjects with spine-femur bone mineral density discordances: the Korean national health and nutrition examination survey (KNHANES 2008-2011)[J]. J Bone Miner Metab, 2019, 37(5): 835-843. doi: 10.1007/s00774-018-0980-6 [18] GU P, PU B, XIN Q, et al. The metabolic score of insulin resistance is positively correlated with bone mineral density in postmenopausal patients with type 2 diabetes mellitus[J]. Sci Rep, 2023, 13(1): 8796. doi: 10.1038/s41598-023-32931-8 [19] MA C, TONKS K T, CENTER J R, et al. Complex interplay among adiposity, insulin resistance and bone health[J]. Clin Obes, 2018, 8(2): 131-139. doi: 10.1111/cob.12240 [20] SHIN D, KIM S, KIM K H, et al. Association between insulin resistance and bone mass in men[J]. J Clin Endocrinol Metab, 2014, 99(3): 988-995. doi: 10.1210/jc.2013-3338 [21] CHOI Y J, KIM D J, LEE Y, et al. Insulin is inversely associated with bone mass, especially in the insulin-resistant population: the Korea and US national health and nutrition examination surveys[J]. J Clin Endocrinol Metab, 2014, 99(4): 1433-1441. doi: 10.1210/jc.2013-3346 [22] LEE K. Sex-specific relationships between insulin resistance and bone mineral content in Korean adolescents[J]. J Bone Miner Metab, 2013, 31(2): 177-182. doi: 10.1007/s00774-012-0396-7 [23] YOON J H, HONG A R, CHOI W, et al. Association of triglyceride-glucose index with bone mineral density in non-diabetic Koreans: KNHANES 2008-2011[J]. Calcif Tissue Int, 2021, 108(2): 176-187. doi: 10.1007/s00223-020-00761-9 [24] ZHANG M, LIU D, QIN P, et al. Association of metabolic score for insulin resistance and its 6-year change with incident type 2 diabetes mellitus[J]. J Diabetes, 2021, 13(9): 725-734. doi: 10.1111/1753-0407.13161 [25] FAN J, GAO S T, WANG L J, et al. Association of three simple insulin resistance indexes with prehypertension in normoglycemic subjects[J]. Metab Syndr Relat Disord, 2019, 17(7): 374-379. doi: 10.1089/met.2019.0029 [26] ICONARU L, MOREAU M, KINNARD V, et al. Does the prediction accuracy of osteoporotic fractures by bmd and clinical risk factors vary with fracture site?[J]. JBMR Plus, 2019, 3(12): e10238. doi: 10.1002/jbm4.10238 -

 点击查看大图
计量
- 文章访问数: 327
- HTML全文浏览量: 189
- PDF下载量: 20
- 被引次数: 0