


A cohort study on the association between sugar-sweetened beverage intake and childhood obesity using a group-based trajectory model
-
摘要:
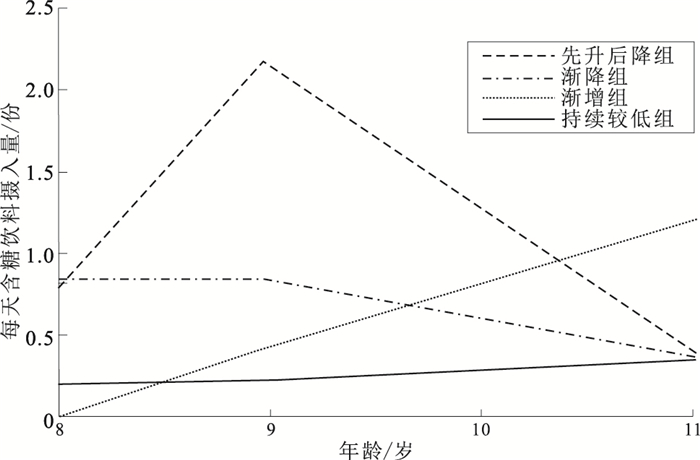
目的 探讨童年期不同含糖饮料(sugar-sweetened beverages,SSBs)摄入模式对儿童肥胖的影响,旨在为预防和控制儿童超重或肥胖提供新的流行病学证据。 方法 采用方便抽样方法,于2016年在安徽省蚌埠市2所小学建立儿童随访队列,每年随访1次,共随访3次。基线有1 263名儿童参加调查,3次随访后最终有997名儿童纳入分析。通过自编父母问卷和学生问卷获得儿童基本信息及每日SSBs消费情况,应用群组轨迹模型(group-based trajectory modelling,GBTM)拟合童年期SSBs摄入模式发展轨迹,采用多元线性回归模型分析不同SSBs摄入模式与儿童肥胖的关联。 结果 GBTM拟合4种童年期SSBs摄入模式发展轨迹,分别命名为SSBs摄入持续较低组(822名)、先升后降组(20名)、渐降组(106名)和渐增组(49名)。SSBs摄入先升后降组和渐增组儿童基线及3次随访时的体质量指数(BMI)均高于持续较低组(F值分别为6.26,5.90,5.99和5.87,P值均<0.01)。SSBs摄入模式与儿童BMI的关联存在性别差异。调整儿童基线BMI、父母BMI、肥胖遗传风险评分和体力活动等混杂因素后,在女童中,相比于SSBs摄入持续较低组,SSBs摄入渐增组女童第3次随访时BMI增加(B=1.20,95%CI=0.25~2.15,P=0.01);在男童中,未发现4组SSBs摄入模式与BMI关联存在统计学意义(P值均>0.05)。 结论 儿童SSBs摄入模式与肥胖关联存在性别差异,SSBs摄入水平较高的女童肥胖风险显著增加。未来需更多研究探讨性别差异的生理机制,为儿童肥胖预防及干预措施的制定提供理论依据。 Abstract:Objective To evaluate the development trajectory of sugar-sweetened beverage (SSB) intake in childhood, and to explore the influence of different SSB intake patterns on childhood obesity. Methods In 2016, a follow-up cohort study was carried out in two primary schools in Bengbu, Anhui Province. Three annual follow-ups were conducted in 1 263 children at baseline, and 997 children were included in the final analysis. Parental and student questionnaires were used to obtain basic information related to the children's consumption of SSBs. A group-based trajectory model (GBTM) was applied to classify the development trajectory of SSB intake patterns in childhood. Multiple linear regression analyses were performed to assess the correlation between different SSB intake patterns and childhood obesity. Results GBTM identified four childhood SSB intake patterns, namely, the "persistently-low group (n=822), "decreasing-after-increasing" group (n=20), "gradually-decreasing" group (n=106), and "increasing" group (n=49). In the decreasing-after-increasing group and the gradually-decreasing group, baseline BMI levels and BMI levels obtained at the three follow-ups were significantly higher than those observed in the persistently-low group (F=6.26, 5.90, 5.99, 5.87, P < 0.01). There were sex differences in the association between SSB intake patterns and the children's BMI levels. Among girls, after adjusting for confounding factors, the gradually-decreasing group increased by 1.20 kg/m2(B=1.20, 95%CI=0.25-2.15, P=0.01) when compared with the persistently low group at the third follow-up. Among boys, no statistically significant association was found between SSB intake patterns and BMI levels (P>0.05). Conclusion Sex differences were observed with respect to the association between SSB intake patterns and obesity in children. Girls with a higher SSB intake had a significantly increased risk of obesity. Further studies are needed to explore the physiological mechanisms underlying sex differences, to provide the theoretical basis for developing intervention programs to prevent childhood obesity. -
Key words:
- Carbohydrates /
- Beverages /
- Feeding behavior /
- Obesity /
- Regression analysis /
- Child
-

图 1 童年期含糖饮料摄入模式发展轨迹
Figure 1. Development trajectory of sugar-sweetened beverages intake pattern in childhood
表 1 不同人口统计学特征儿童童年期含糖饮料摄入模式分布比较
Table 1. Distribution of different demographic variables among children in different groups of sugar-sweetened beverages intake pattern during childhood
人口统计学指标 选项 人数 持续较低组 先升后降组 渐降组 渐增组 χ2值 性别 男 418 326(77.99) 12(2.87) 50(11.96) 30(7.18) 13.11* 女 579 496(85.66) 8(1.38) 56(9.68) 19(3.28) 家庭月收入/元 <10 000 187 150(80.22) 3(1.60) 21(11.23) 13(6.95) 3.79 10 000~15 000 630 519(82.38) 15(2.38) 67(10.64) 29(4.60) >15 000 180 153(85.00) 2(1.11) 18(10.00) 7(3.89) 父亲文化程度 高中及以下 490 385(78.57) 11(2.24) 66(13.47) 28(5.72) 8.61* 大专 292 250(85.62) 5(1.71) 23(7.88) 14(4.79) 本科及以上 215 187(86.97) 4(1.86) 17(7.91) 7(3.26) 母亲文化程度 高中及以下 585 466(79.66) 12(2.05) 72(12.31) 35(5.98) 8.36* 大专 267 229(85.77) 4(1.50) 24(8.99) 10(3.74) 大学及以上 145 127(87.58) 4(2.76) 10(6.90) 4(2.76) 注: ()内数字为构成比/%;*P < 0.05;父母文化程度为趋势性χ2检验。  下载: 导出CSV
表 2 不同含糖饮料摄入组儿童各特征比较(x±s)
Table 2. Comparison of children's characteristics in different sugar-sweetened beverages intake groups(x±s)
组别 人数 年龄
(T3)/岁BMI/(kg·m-2) 睡眠时长
(T3)/h家庭逆境数量(T3) 童年期不良经历数量(T3) T0 T1 T2 T3 持续较低组 822 11.01±0.80 17.85±2.91 18.47±3.22 18.66±3.54 19.62±3.87 9.00±0.71 0.41±0.83 1.79±2.13 先升后降组 20 11.00±0.35 19.58±4.23 20.28±4.32 20.25±4.58 21.46±5.18 8.96±0.80 0.61±0.94 2.22±2.19 渐降组 106 10.97±0.44 17.83±2.56 18.58±2.83 18.91±3.11 19.83±3.38 8.92±0.82 0.26±0.56 1.84±1.92 渐增组 49 11.11±0.36 19.38±3.48 20.13±3.80 20.64±3.89 21.73±4.16 8.65±0.58 0.41±0.88 1.54±1.62 F值 0.43 6.26** 5.90* 5.99** 5.87* 3.92* 1.83 1.53 注: *P < 0.05,**P < 0.01。
下载: 导出CSV
表 3 不同含糖饮料摄入模式及协变量指标与男女童BMI关联的多元线性回归分析[B值(B值95%CI)]
Table 3. Multiple linear regression analysis of the association between different groups of sugary-sweetened beverages intake pattern, covariate indexes and BMI of boys and girls [B(B 95%CI)]
自变量 男童(n=418) 女童(n=579) 含糖饮料摄入模式 先升后降组 -0.23(-1.58~1.12) -0.37(-1.78~1.04) 渐降组 0.39(-0.33~1.12) -0.06(-0.61~0.50) 渐增组 -0.17(-1.20~0.85) 1.20(0.25~2.15)* 儿童BMI(T0) 1.11(1.02~1.19) 1.07(1.01~1.13)** 父亲BMI 0.05(-0.03~0.14) 0.04(-0.02~0.10) 母亲BMI 0.09(-0.01~0.19) 0.14(0.08~0.21)** 出生体重 -0.35(-0.90~0.19) 0.09(-0.27~0.46) 喂养方式 0.17(-0.15~0.49) -0.06(-0.28~0.16) 家庭月收入 -0.14(-0.40~0.13) -0.10(-0.26~0.06) 肥胖遗传风险评分 -0.25(-0.74~0.24) -0.23(-0.56~0.11) 睡眠时长(T3) -0.03(-0.37~0.30) -0.13(-0.37~0.12) 体力活动(T3) -0.24(-0.14~0.09) -0.08(-0.16~0.01) 家庭逆境数量(T3) -0.05(-0.37~0.26) -0.12(-0.35~0.12) 童年期不良经历 -0.04(-0.16~0.09) 0.05(-0.04~0.15) 数量(T3) 注: *P < 0.05,**P < 0.01。
下载: 导出CSV
-
[1] NCD Risk Factor Collaboration (NCD-RISC). Worldwide trends in body-mass index, underweight, overweight, and obesity from 1975 to 2016: a pooled analysis of 2416 population-based measurement studies in 128.9 million children, adolescents, and adults[J]. Lancet, 2017, 390(10113): 2627-2642. doi: 10.1016/S0140-6736(17)32129-3 [2] CHUNG S T, ONUZURUIKE A U, MAGGE S N. Cardiometabolic risk in obese children[J]. Ann N Y Acad Sci, 2018, 1411(1): 166-183. doi: 10.1111/nyas.13602 [3] IRVINE V, JOHN J R, SCOTT J A, et al. Factors influencing the early introduction of sugar sweetened beverages among infants: findings from the HSHK birth cohort study[J]. Nutrients, 2020, 12(11): 3343. doi: 10.3390/nu12113343 [4] HU F B. Resolved: there is sufficient scientific evidence that decreasing sugar-sweetened beverage consumption will reduce the prevalence of obesity and obesity-related diseases[J]. Obes Rev, 2013, 14(8): 606-619. doi: 10.1111/obr.12040 [5] 赵莉, 黎隐豪, 肖成汉, 等. 含糖饮料与儿童肥胖的关系及其防控政策研究进展[J]. 中国学校卫生, 2020, 41(3): 468-470. doi: 10.16835/j.cnki.1000-9817.2020.03.043ZHAO L, LI Y H, XIAO C H, et al. Research on the relationship between sugar-sweetened beverages and childhood obesity and its prevention and control policies[J]. Chin J Sch Health, 2020, 41(3): 468-470. doi: 10.16835/j.cnki.1000-9817.2020.03.043 [6] KELLER A, BUCHER D T S. Sugar-sweetened beverages and obesity among children and adolescents: a review of systematic literature reviews[J]. Child Obes, 2015, 11(4): 338-346. doi: 10.1089/chi.2014.0117 [7] ZHANG T, AU Y S, KWOK M K, et al. Association of sugar-sweetened beverage frequency with adiposity: evidence from the "children of 1997" birth cohort[J]. Nutrients, 2020, 12(4): 1015. doi: 10.3390/nu12041015 [8] 陈新, 王元银, 孙晓瑜, 等. 基于群组轨迹模型的含糖饮料摄入模式与儿童牙周健康关联的队列研究[J]. 中华流行病学杂志, 2020, 41(8): 1308-1312. doi: 10.3760/cma.j.cn112338-20190826-00627CHEN X, WANG Y Y, SUN X Y, et al. Pattern of sugar-sweetened beverages consumption-based on group-based trajectory modeling and its association with childhood periodontal health[J]. Chin J Epidemiol, 2020, 41(8): 1308-1312. doi: 10.3760/cma.j.cn112338-20190826-00627 [9] FANG J, GONG C, WAN Y, et al. Polygenic risk, adherence to a healthy lifestyle, and childhood obesity[J]. Pediatr Obes, 2019, 14(4): e12489. doi: 10.1111/ijpo.12489 [10] BERNSTEIN D P, STEIN J A, NEWCOMB M D, et al. Development and validation of a brief screening version of the Childhood Trauma Questionnaire[J]. Child Abuse Negl, 2003, 27(2): 169-190. doi: 10.1016/S0145-2134(02)00541-0 [11] NGUENA N H, PAGE M G, KATZ J, et al. Trajectory modelling techniques useful to epidemiological research: a comparative narrative review of approaches[J]. Clin Epidemiol, 2020, 12: 1205-1222. DOI:2147/clep.s265287. [12] PAN F, TIAN J, AITKEN D, et al. Predictors of pain severity trajectory in older adults: a 10.7-year follow-up study[J]. Osteoarthrit Cartil, 2018, 26(12): 1619-1626. doi: 10.1016/j.joca.2018.08.002 [13] ROSINGER A, HERRICK K, GAHCHE J, et al. Sugar-sweetened beverage consumption among U.S. youth, 2011-2014[J]. NCHS Data Brief, 2017(271): 1-8. [14] GUI Z H, ZHU Y N, CAI L, et al. Sugar-sweetened beverage consumption and risks of obesity and hypertension in Chinese children and adolescents: a national cross-sectional analysis[J]. Nutrients, 2017, 9(12): 1302. doi: 10.3390/nu9121302 [15] FIORITO L M, MITCHELL D C, SMICIKLAS-Wright H, et al. Dairy and dairy-related nutrient intake during middle childhood[J]. J Am Diet Assoc, 2006, 106(4): 534-542. doi: 10.1016/j.jada.2006.01.005 [16] 贾梦, 王超, 张玉梅, 等. 北京市部分中学生含糖软饮料消费与肥胖的调查[J]. 卫生研究, 2012, 41(2): 310-312. https://www.cnki.com.cn/Article/CJFDTOTAL-WSYJ201202036.htmJAI M, WANG C, ZHANG Y M, et al. Investigation on consumption of sugary soft drinks and obesity among middle school students in Beijing[J]. J Hyg Res, 2012, 41(2): 310-312. https://www.cnki.com.cn/Article/CJFDTOTAL-WSYJ201202036.htm [17] 张曌华, 张柳, 李红娟. 中国儿童青少年体力活动现状的Meta分析[J]. 中国学校卫生, 2020, 41(2): 173-178. doi: 10.16835/j.cnki.1000-9817.2020.02.004ZHANG Z H, ZHANG L, LI H J. A Meta-analysis of physical activity among Chinese children and adolescents with accelerometer data[J]. Chin J Sch Health, 2020, 41(2): 173-178. doi: 10.16835/j.cnki.1000-9817.2020.02.004 [18] CHAPUT J P, WILLUMSEN J, BULL F, et al. 2020 WHO guidelines on physical activity and sedentary behaviour for children and adolescents aged 5-17 years: summary of the evidence[J]. Int J Behav Nutr Phys Act, 2020, 17(1): 141. doi: 10.1186/s12966-020-01037-z [19] 孙莹, 刘阳, 苏普玉, 等. 小学生童年期不良经历与超重肥胖的关联[J]. 中国学校卫生, 2015, 36(2): 255-258. http://www.cjsh.org.cn/article/id/zgxxws201502027SUN Y, LIU Y, SU P Y, et al. Associations between adverse childhood experiences with overweight/obesity and possible gender difference[J]. Chin J Sch Health, 2015, 36(2): 255-258. http://www.cjsh.org.cn/article/id/zgxxws201502027 -

 点击查看大图
计量
- 文章访问数: 1289
- HTML全文浏览量: 563
- PDF下载量: 191
- 被引次数: 0